BTC/USDT Analisys
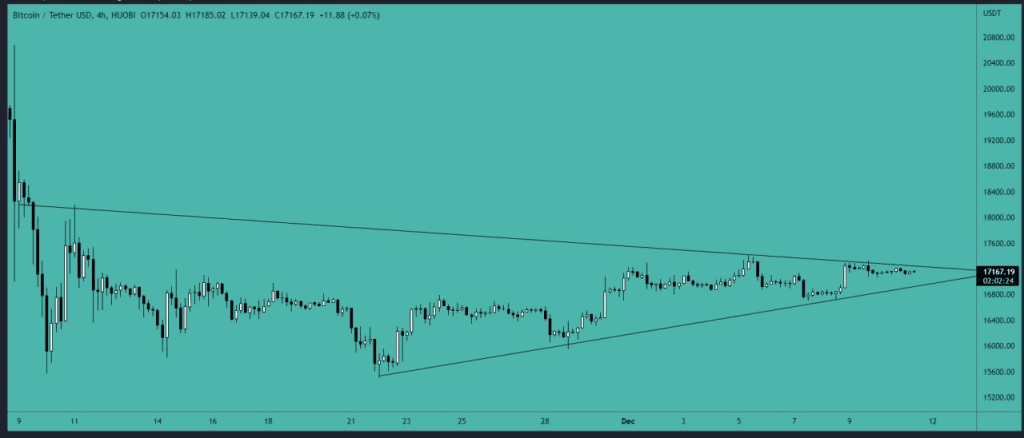
There is a symmetrical triangle on the hourly graph, and we will soon see a rupture of this figure. If the BTC breaks the triangle in the ascending direction, we will see a movement to the level of $ 20,000. If the price broke the triangle in the descending direction, we will see the test of the main support of the support of 15,000-15,500 dollars.